Our NC Fines and Fees Data Website
Today we launched a new CSJ report on the explosion of fines and fees in North Carolina. As a companion to the report, we created, with outstanding work by Caroline Levenson, Duke Class of '22, a data resource website here. The About page where you start, gives you a brief overview of our findings - examining three decades of NC data. Below is a guide to the website, by post-doctoral fellow Dr. William Crozier.
The second tab, Length of FTCs, displays information about how quickly FTCs are paid off - or in the case of nearly 40%, not paid off ever. This is filterable by County, as well as by other factors as you can see her eon this dropdown menu, such as race, age group, sex, or charge type. So for example, if you were interested in how quickly FTCs only for traffic cases are paid off, you can select traffic cases, and observe an image displaying the results.

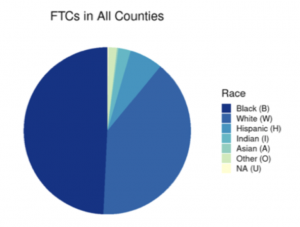
The third tab, demographics, allows a user to check out how FTCs are distributed across different racial groups. You can look inside an individual county, or for different charge or race groups. You can also look at FTC length max and mins. So say you were only interested in FTCs that last longer than a year - you can use this slider bar to view that subset of FTCs. The data are presented as a table, as well as a box-and-whisper plot, which is a graph type that gives information about the data's median values and how widely or closely the length of FTCs are distributed.
The fourth tab provides a geographical presentation, presenting heat maps for number of FTCs and length of FTCs by county, as well as a searchable table for all 100 counties. This page allows the user to see how different counties issue FTCs differently...and how some counties have much longer FTCs than others.

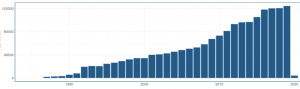
The final tab shows how many FTCs are issued per year, and how many are active in each year, pretty clearly displaying that more and more FTCs are being charged each year, and they are not going away.